Strategy
Owns the number and decides what gets built next.


Tourwatchout
A travel operator spending more each quarter for the same number of bookings. We rebuilt the account around what actually converts, then let the budget follow the demand instead of the calendar.
+28%
Revenue
YoY, same headcount
-19%
Ad spend
Blended, 12 months
3.1x
ROAS
Up from 1.8x
-41%
Cost per booking
Organic + paid
01/IN MOTION



02/THE WORK ITSELF
03/THE CHALLENGE
Traffic was never the problem. Enquiries arrived on WhatsApp, email and three separate forms, then sat. No owner, no follow-up window, no way to tell which channel produced a booking — so spend kept scaling the wrong thing.
Four channels, one inbox, and no record of which enquiry came from where.
The median first reply was eleven hours. Most travel decisions are made in two.
A single page asked to sell nine itineraries to nine different intents.
Not demand. Peak weeks were under-funded and quiet weeks paid for themselves twice.
04/OUR APPROACH
One conversion that matched a real enquiry, so the platform finally optimised towards the right event.
Nine itineraries, nine pages, each answering the one question that itinerary's buyer actually asks.
Budget moved to where the return was, weekly, with Standard Shopping holding the under-performers.
05/THE TEAM
No hand-offs between agencies. One group, one number to answer for.
Owns the number and decides what gets built next.
Search, social and shopping, run daily rather than reported monthly.

Short-form and static, tested against each other before spend follows.

Pages, speed and the path from click to enquiry.
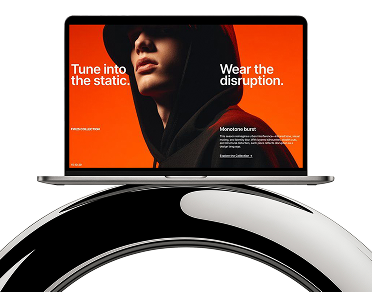
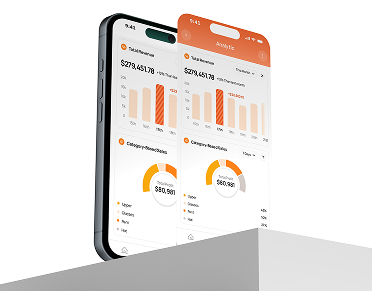
Tracking, attribution and the one dashboard everyone argues from.
06/HOW IT RAN
Everything measured before anything was changed.
Campaigns rebuilt around intent, not around product names.
A page per itinerary, and the first round of short-form angles.
Budget moved weekly. The winners kept it; the rest were retired.
07/STACK
08/WHERE IT LANDED
+28%
Revenue growth
YoY, same headcount
-19%
Ad spend
Blended, 12 months
+64%
Qualified enquiries
vs. pre-engagement baseline
-41%
Cost per booking
Blended

LET'S TALK YOUR NEEDS